
What Is Reporting Automation? Everything You Need to Know
The pressure to deliver insights quickly is more significant than ever. Businesses are increasingly leveraging report automation to streamline processes and improve accuracy. By automating reports, organisations can save time and enhance decision-making capabilities, ensuring that stakeholders have the information they need when needed. Are you still relying on manual reporting methods that consume valuable resources?
What is Report Automation?
Report automation is a critical process that leverages advanced technology to generate, format, and distribute reports automatically. This automation empowers various businesses.
Key Features of Report Automation Tools
Automated reporting tools come with various features designed to enhance productivity and efficiency.
-
Streamlined Workflows
By integrating various data sources, automated reporting tools reduce manual data entry, allowing teams to focus on analysis rather than collection. For instance, businesses using Tableau can pull insights into visually appealing dashboards that are updated automatically, saving time and minimising errors.
-
Improved Decision-Making
Automate report generation at specified intervals, ensuring timely updates that allow decision-makers to act swiftly on new insights. For example, retail businesses can use automated reports to monitor inventory levels, adjusting strategies based on sales trends. According to McKinsey, data-driven decision-making increases customer acquisition by 23 times.
-
Enhanced Collaboration
Automated reports improve cross-department collaboration by making insights readily accessible. Tools like Google Data Studio enable real-time viewing and editing, fostering team transparency and cooperation.
-
Increased Accuracy
Automation minimises errors that are common in manual report generation. This ensures data is consistently formatted, leading to improved reliability. Forrester reports that companies adopting automation see a 50% reduction in reporting errors, enhancing data integrity.
-
Customisation for Specific Needs
Automated reporting tools allow for tailored reports, ensuring stakeholders receive relevant insights. For example, finance teams may require detailed budget reports, while marketing focuses on campaign performance analytics. Looker enables personalised dashboards for each team.
How Does Report Automation Work?
To illustrate the report automation process, consider a project management scenario involving a software development team that uses Jira to track tasks and progress.
Here’s a detailed explanation of how report automation works, illustrated with a single example from project management:
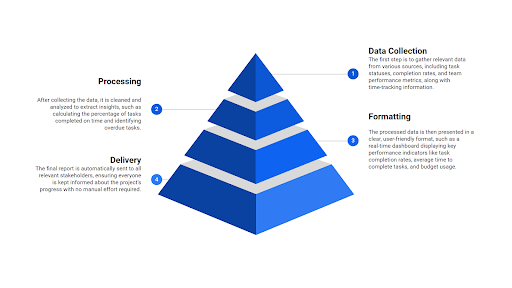
1. Data Collection
The first step involves gathering data from various sources. In our example, the project manager pulls data from Jira, which contains information on task statuses, completion rates, and team performance metrics. The data may also include input from a time-tracking tool that logs hours worked by team members.
2. Processing
After data collection, an automated reporting system processes the data. This system cleans the collected information by filtering out irrelevant entries (such as uncompleted or outdated tasks) and analyses it to derive insights. For instance, it may calculate the percentage of tasks completed on time and identify any overdue tasks.
3. Formatting
Once the data has been processed, the system generates the report in a user-friendly format. In our scenario, the automated system creates a real-time dashboard that showcases key performance indicators (KPIs) such as:
- Percentage of tasks completed
- Average time taken to complete tasks
- Budget usage vs. budget planner
This dashboard allows stakeholders to visualise project progress at a glance.
4. Delivery
Finally, the automated reporting tool delivers the report to all relevant stakeholders. In this case, the project manager sets up the system to automatically send a weekly email containing the dashboard link to team members, stakeholders, and executives. This ensures everyone stays informed about the project’s status without requiring manual intervention.
Time to Recap:
1️⃣ Data Collection
2️⃣ Processing
3️⃣ Formatting
4️⃣ Delivery
Challenges in Report Automation and How to Overcome Them
-
Data security Challenges
Businesses face significant data security concerns when implementing report automation due to the need for sensitive data access. To mitigate risks, it’s essential to implement strong security measures like encryption and access controls, along with regular audits to identify vulnerabilities in automated data reporting.
2.Design Challenges
Designing effective reports can pose a challenge in automation. Poorly structured reports can lead to misunderstandings. Focusing on user-centred design principles and engaging stakeholders during the design phase can help create clear, actionable reports that enhance the automation of report generation.
3.Slow Adoption by Employees
Resistance to adopting automated reporting tools is common as employees may prefer familiar manual processes. To encourage faster adoption, organisations should provide comprehensive training and ongoing support, demonstrating the advantages of automated reporting systems to ease the transition and promote efficiency.
Elevate your reporting game with automation
Embracing report automation is essential for enhancing business efficiency and decision-making. By utilising automated reporting tools, organisations can achieve greater accuracy, save time, and swiftly adapt to changing needs. Explore onetab’s innovative reporting features to transform your reporting processes today! Discover how to streamline your workflow and gain a competitive edge.